Difference between revisions of "Component: GLCD Graph Creator XY (Graphical Library)"
From Flowcode Help
Jump to navigationJump to search| Line 20: | Line 20: | ||
==Detailed description== | ==Detailed description== | ||
| + | |||
| + | |||
| Line 32: | Line 34: | ||
==Examples== | ==Examples== | ||
| + | |||
| + | |||
| Line 141: | Line 145: | ||
| width="10%" align="center" style="background-color:#D8C9D8;" | [[File:Fc9-prop-icon.png]] | | width="10%" align="center" style="background-color:#D8C9D8;" | [[File:Fc9-prop-icon.png]] | ||
| width="90%" style="background-color:#D8C9D8; color:#4B008D;" | '''Properties''' | | width="90%" style="background-color:#D8C9D8; color:#4B008D;" | '''Properties''' | ||
| + | |- | ||
| + | |- | ||
| + | | width="10%" align="center" style="background-color:#EAE1EA;" | [[File:Fc9-conn-icon.png]] | ||
| + | | width="90%" style="background-color:#EAE1EA; color:#4B008D;" | Display Properties | ||
|- | |- | ||
|- | |- | ||
| Line 172: | Line 180: | ||
|- | |- | ||
| colspan="2" | Vertical size of the graph in pixels | | colspan="2" | Vertical size of the graph in pixels | ||
| + | |- | ||
| + | | width="10%" align="center" style="background-color:#EAE1EA;" | [[File:Fc9-conn-icon.png]] | ||
| + | | width="90%" style="background-color:#EAE1EA; color:#4B008D;" | Graph Properties | ||
| + | |- | ||
|- | |- | ||
| width="10%" align="center" | [[File:Fc9-type-16-icon.png]] | | width="10%" align="center" | [[File:Fc9-type-16-icon.png]] | ||
| Line 227: | Line 239: | ||
|- | |- | ||
| colspan="2" | Number of vertical divisions to draw | | colspan="2" | Number of vertical divisions to draw | ||
| + | |- | ||
| + | | width="10%" align="center" style="background-color:#EAE1EA;" | [[File:Fc9-conn-icon.png]] | ||
| + | | width="90%" style="background-color:#EAE1EA; color:#4B008D;" | Theme | ||
| + | |- | ||
|- | |- | ||
| width="10%" align="center" | [[File:Fc9-type-1-icon.png]] | | width="10%" align="center" | [[File:Fc9-type-1-icon.png]] | ||
| Line 242: | Line 258: | ||
|- | |- | ||
| colspan="2" | Determines the graph plot colour. | | colspan="2" | Determines the graph plot colour. | ||
| − | |||
| − | |||
| − | |||
| − | |||
| − | |||
| − | |||
| − | |||
| − | |||
|} | |} | ||
Latest revision as of 17:25, 9 November 2022
| Author | Matrix TSL |
| Version | 1.2 |
| Category | Graphical Library |
Contents
GLCD Graph Creator XY component
A component to simplify the process of drawing XY graphs and charts using a graphical LCD.
Component Pack
DISPLAYS
Detailed description
No detailed description exists yet for this component
Examples
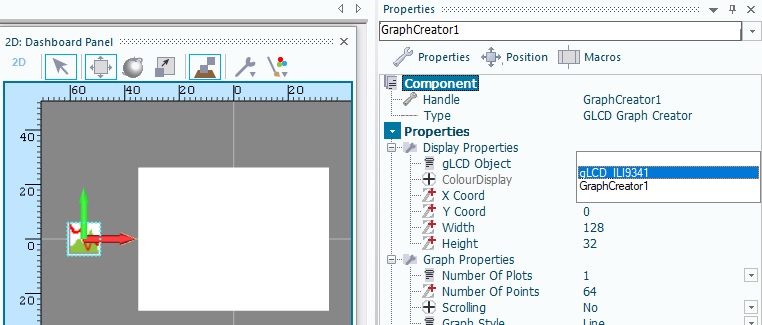
The graph creator XY component must be linked to the graphical LCD using the gLCD Object property.
The X Coord, Y Coord, Width and Height component properties set the size and position of the graph on the gLCD.
In the attached example the ADC component sets the input to the graph. Every 50ms a sample is taken and added to the graph.
Any size of graph can be created. For efficiency it is best to try and stick to the following rules.
- The width should be equal to or a multiple of the X input range - Min Value 0 to Max Value 255 = input range of 256
- The height should be equal to or a multiple of the Y input range - Min Value 0 to Max Value 255 = input range of 256
- If Show Border is enabled then Width and Height should be as above plus 2 to account for the border pixels
Downloadable macro reference
| ExportToCSV | |
| Exports the data in the graph to a CSV file. | |
| Filename | |
| Erase | |
| 0=Append existing data, 1=Reset file data | |
| Return | |
| AddPoint | |
| Adds a new data point to the graph. | |
| X | |
| X Data Value to plot | |
| Y | |
| Y Data Value to plot | |
| Index | |
| Plot Index: Range 0-7 | |
| Return | |
| Initialise | |
| Initialises the graph object on the GLCD to the specified dimensions. | |
| Return | |

