Simulation Debugger
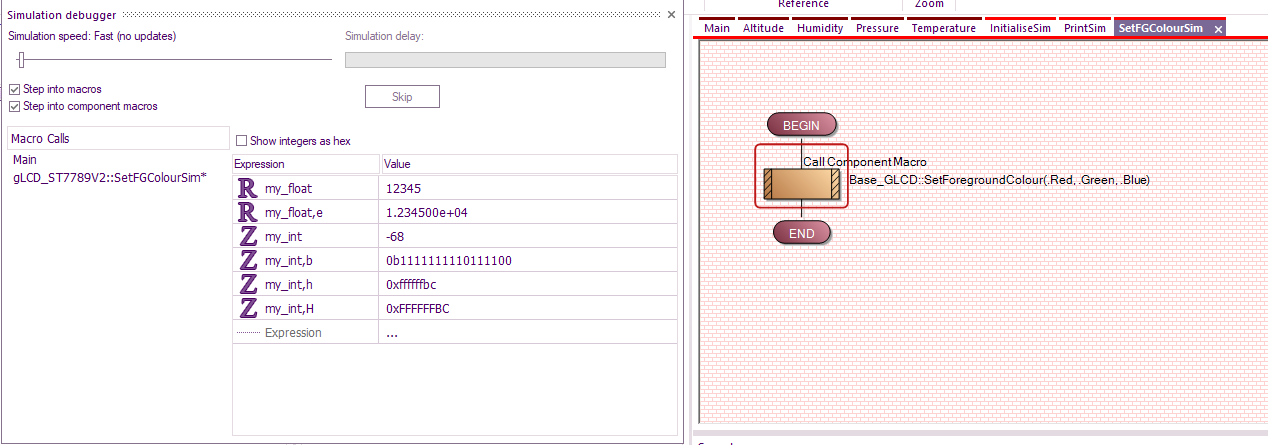
The simulation debugger window becomes active during simulation. It is used to monitor the status of the variables in your program and the macros which are being called. Despite it's name, the simulation debugger also supports ICD mode, allowing for the macro call stack and variable values to be read directly from the microcontroller as it runs. It can also be used to pass or receive values of memory locations and registers on board the target microcontroller. This is useful for detecting and troubleshooting call stack overflows and precisely monitor the program as it runs in hardware.
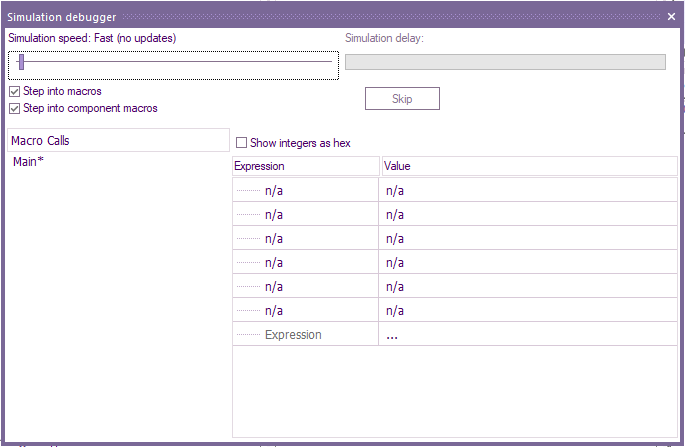
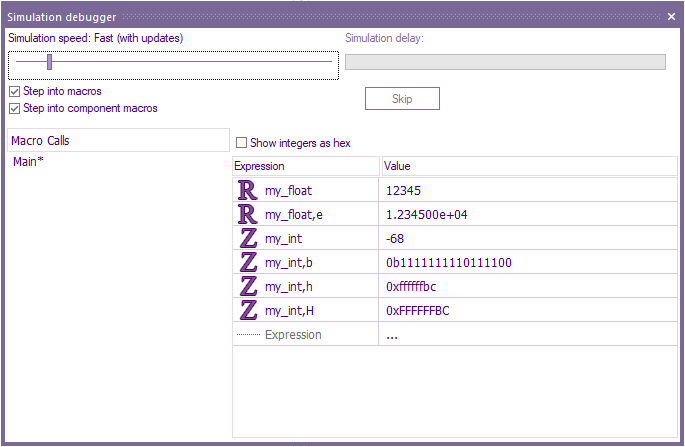
When operating in 'normal speed', variables are not updated live. However, when the simulation is paused, running at a slower speed or 'Step Into' and 'Step Over' are used, the variables are updated.
You can actively change the speed of the simulation using the slider at the top left of the Simulation Debugger window, the default simulation speed is 'Normal' where no updating of variables visually occurs. The speed can also be reduced from 50Hz down to 0.25Hz, this will result in the simulation going through each icon individually at the specified speed and variables can be seen to update.
If you have a professional licence, then an additional Step into component macros will be available.
This will allow you to step through all added components code.
The components code will have a brick-type effect within the background and the borderline above and below the macro title will be bright red.

There is also a 'Simulation delay:' section at the top right of the 'simulation debugger' window which displays the length and progress of delays set by Delay icons. This feature alerts you of long delays, to confirm the simulation has not crashed. It also allows users the ability to 'Skip' any delays and move to the next icon.
Monitoring and changing variable values during Simulation
When simulating, variable values can be monitored and overriden from the 'simulation debugger' window by clicking on the 'Value' box next to the variable name and inputting a value.
The variable values includes format overrides. These can be added by adding a suffix after the variable name within the watch window entry (for example, "my_var,b" will display that variable's value in binary).
The supported formats are:
- ,d - decimal
- ,h - hexadecimal (lowercase)
- ,H - hexadecimal (uppercase)
- ,b - binary
- ,e - standard form
Standard form is only supported for floating point variables, and the other formats are only supported for integer variables.
These suffixes only work with single variables; expressions and arrays are not currently supported. Variables and expressions without the suffix will be displayed using the default settings.
Integer variables can have their values altered in the watch window using decimal, hex and binary representations. Floating point values can only be entered using their default decimal format (e.g. 0.00234).
When using ICD Mode, you can still manually adjust variable values to allow you to skip certain elelemts of code.

