Difference between revisions of "Simulation Debugger"
| Line 15: | Line 15: | ||
| − | There is also a 'Simulation delay:' section at the top right of the 'Simulation | + | There is also a 'Simulation delay:' section at the top right of the 'Simulation debugger' window which displays the length and progress of delays set by [[Delay Icon Properties|Delay icons]], this section also allows you to skip the delay by pressing the 'Skip' button which will stop the delay and carry on with the program and go to the next icon. |
'''Changing variables during Simulation''' | '''Changing variables during Simulation''' | ||
| − | When simulating variable values can be changed from the Simulation | + | When simulating variable values can be changed from the 'Simulation debugger' window by clicking on the 'Value' box next to the variable name and then simply typing in a value. |
Revision as of 14:38, 19 September 2013
<sidebar>Sidebar: Overview of Simulation</sidebar>
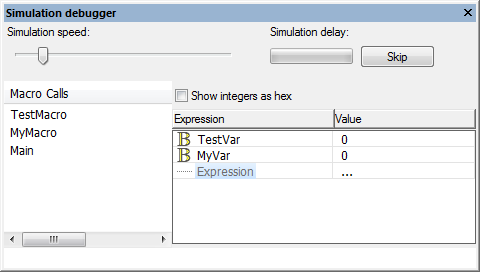
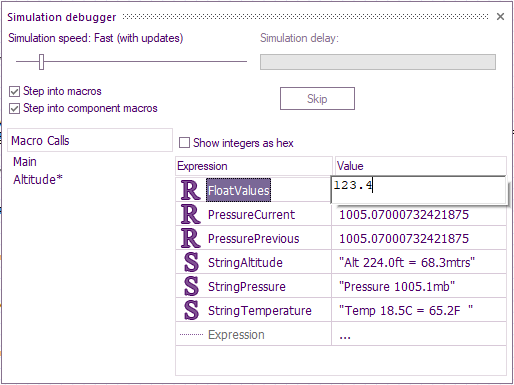
The Simulation debugger window becomes active during simulation, it is used to monitor the status of the variables in your program and the macros which are being called, this monitors the process of the microcontroller (and simulation) when running the program.
The Macro Calls and Variable values are updated when the simulation is paused, using 'Step Into' and 'Step Over' allows you to accurately monitor and debug your flowchart program you can also control components this way to accurately record component functions.
The Simulation debugger also supports the ICD mode allowing for the macro call stack and variable values to be read directly from the microcontroller as it runs, it can also be used to pass or receive values of memory locations and registers on board the target microcontroller. This is useful for detecting and troubleshooting call stack overflows and precisely monitor the program as it runs.
You can actively change the speed of the simulation using the slider at the top left of the Simulation Debugger window, the default simulation speed is 'Normal' although it can be increased to 'As fast as possible' although this may result in graphic tearing. The speed can also be reduced from 50Hz down to 0.25Hz, this will result in the simulation going through each icon individually at the specified speed.
There is also a 'Simulation delay:' section at the top right of the 'Simulation debugger' window which displays the length and progress of delays set by Delay icons, this section also allows you to skip the delay by pressing the 'Skip' button which will stop the delay and carry on with the program and go to the next icon.
Changing variables during Simulation
When simulating variable values can be changed from the 'Simulation debugger' window by clicking on the 'Value' box next to the variable name and then simply typing in a value.
If the ICD Mode is enabled in your Project Options then stepping into or over icons during simulation will cause the ICD hardware to react accordingly. Changing variable values during the simulation will also work seamlessly with the ICD operation.
You can change variable values during simulation to alter the program accordingly, by doing so you can control components and quickly test them without the use of other inputs and icons to help and locate the error and improve the program.

